Debugging with PlatformIO: Part 3. PlatformIO Unified Debugger in CLI mode
A crash course on working with PlatformIO Unified Debugger via command-line interface
Previously in this series we discussed the debugging workflow of desktop and embedded applications using the graphical facilities of VSCode. IDEs can provide the necessary functionality in many cases, but what to do when there isn’t any graphical frontend that can provide you all the tools and buttons to step through code and examine the execution process?
This is the third part (Part 1, Part 2) of a series where we’re exploring the capabilities of PlatformIO Unified Debugger. In this post we will cover the essential functionality in CLI mode that is extremely useful in cases when we don’t have the luxury of using a full-featured development environment. This post will give you a set of essential recommendations so that you can hunt down bugs much efficiently even without an IDE at hand.
Throughout this post, we will be using the SiFive HiFive1 Rev B board and Freedom E SDK as the development framework, but the techniques described here can be used with pretty much any target.
If you are new to the series, you may find the Debugging with PlatformIO: Part 1. Back to the Basics a useful starting point.
Table of Contents
Prerequisites
This article uses the following components:
Unified Debugger in CLI Mode
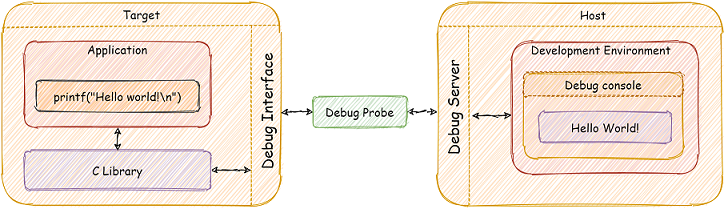
In previous articles we reviewed all essential components of the debugging process. One last piece that remained undefined is PlatformIO Unified Debugger itself. During several last years we’ve been looking into the problem of the enormous complexity of the usual embedded software development tasks. As it turned out, setting all parts of the debug process is quite a challenge. That’s why we’ve developed a unique instrument that abstracts away all the complexity of actual low-level debugging tasks like compiling firmware with debug symbols, setting up a debug server, configuring a target to reset the chip, and halt it at a specific line of code, etc. PlatformIO takes care of all these complex configuration steps behind the scenes and provides a rich command-line interface, so developers can focus solely on the debugging process. A huge additional benefit of this approach is that developers can conveniently switch among a huge range of debug frontends (IDEs, editors, etc.), debug probes, and debug servers while keeping the same unified configuration.
Let’s go deeper into the usual workflow and essential commands used when we run PlatformIO Unified Debugger in the CLI mode.
Getting Started
As we outlined earlier, we are using the HiFive RevB board in this post. First, let’s install the SiFive development platform:
$ pio platform install sifive
PlatformIO will do all the heavy lifting for us by installing everything that is needed (toolchains, frameworks, etc.) automatically. For the sake of simplicity, let’s get started by compiling the freedom-e-sdk_sifive-welcome example shipped together with the platform:
# Navigate to the project folder
$ cd /home/<user>/.platformio/platforms/sifive/examples/freedom-e-sdk_sifive-welcome
# Build example for the sifive-hifive1-revb environment
$ pio run -e sifive-hifive1-revb
If everything went well, we should see the successful result in the terminal window.
We compiled our project example, now let’s move to the debugging. We can start a new debug session in the CLI mode using the following command:
$ pio debug --interface=gdb -x .pioinit
The --interface option specifies the name of the underlying debugger (in our case it’s GNU Debugger) and .pioinit is a pregenerated file with the default configuration for the current target. More info on the available flags can be found in the docs for the debug command.
Once the initialization is completed, the output should look something like this:
(gdb) PlatformIO: Resume the execution to `debug_init_break = tbreak main`
Setting breakpoint @ address 0x200115BA, Size = 2, BPHandle = 0x0001
Starting target CPU...
...Breakpoint reached @ address 0x200115BA
Reading all registers
Removing breakpoint @ address 0x200115BA, Size = 2
Temporary breakpoint 1, main () at src/sifive-welcome.c:84
84      {
(gdb)
Starting from this point we can type commands directly in the terminal.
Essential Commands
A thorough overview of all available commands is out of the scope for this post, but let’s review some fundamental commands for effective debugging in the CLI mode.
Basic Navigation
Navigation in the code is essential functionality required to carefully examine the program’s state and behavior. The workflow is pretty much similar to the control actions available in any IDE. We can inspect the code line-by-line, step into functions or run the program until a breakpoint is reached. Here are the most common and often-used commands and their shortcuts for controlling the execution flow:
# Continue execution
(gdb) [c]ontinue
# Step one line of code (steps into function calls).
(gdb) [s]tep
# Step one line of code (steps over function calls).
(gdb) [n]ext
# Run until a source line past the current line
frame, is reached.
(gdb) [u]ntil
# Run until the current function returns.
(gdb) [f]inish
A typical scenario for using stepping is to set a breakpoint in your program where a bug is supposedly located, run your program until it stops at that breakpoint, and then step through the code, checking the most relevant variables, until the problem occurs.
Breakpoints
As we discussed in the previous post, breakpoints is an extremely useful technique when we want to check the program’s state in a specific situation or condition. We can set breakpoints on a function name, a line number, or an instruction located at a particular address. The syntax for setting breakpoints is the following:
[b]reak <line | function | filename:line | filename:function | *memory address>
When we create a new breakpoint, the debugger will assign a number to it. For example:
# Set a breakpoint at a function name
(gdb) break metal_led_get_rgb
Read 2 bytes @ address 0x20013F18
Breakpoint 6 at 0x20013f18: file src/led.c, line 8.
If we need to put a breakpoint somewhere in the middle of a function, we can specify a line number. To break in a different file, we need to specify the file name followed by a colon and the line number:
# Set a temporary breakpoint at a line in the current file
(gdb) break 5
# or a specific line in a file
(gdb) break led.c:13
We also can set a temporary breakpoint which will be deleted after the first time it’s hit: bash # Set a temporary breakpoint at a function name (gdb) tbreak main # or a specific address (gdb) break *0x20013f18
To control breakpoints (enable/disable/delete) we can use the following commands:
# Enable/disable a breakpoint using its number
(gdb) disable 2
(gdb) enable 2
# Clear all breakpoints in a function
(gdb) clear metal_led_get_rgb
# Clear all breakpoints at a given line
(gdb) clear led.c:18
# Delete specific breakpoints
(gdb) delete 5 6
Conditional Breakpoints
Sometimes, we need to stop the execution not only at a specific location but also when a certain condition is met. Conditional breakpoints can help with this by allowing more precise control of the reason for the program to stop. If the execution reaches the conditional breakpoint and the expression evaluates to false, then the debugger will automatically skip the breakpoint and let the program continue without notifying the user. A conditional breakpoint can be created by combining the usual breakpoint command with a specific condition:
[b]reak <line | function | filename:line | filename:function | *memory address> <condition>
Here are a few examples:
# Set a breakpoint at a function name with a condition
(gdb) break wait_for_timer if timer_isr_flag == 0
# Set a temporary breakpoint when a specific value in a CPU register
(gdb) tbreak sifive_gpio-leds.c:58 if $a6 == 0x80000f90
Watchpoints
Watchpoints are very similar to breakpoints which we discussed above. Unlike breakpoints which are set for functions or lines of code, watchpoints are set on expressions. Simply put, a watchpoint is just a special kind of breakpoint that stops the execution when the value of an expression changes without having to predict a specific location where this may happen. Watchpoints can monitor a simple variable or more complex expressions:
# Watch a variable
(gdb) watch rc
# Watch an address in memory
(gdb) watch *(uint8_t *)0x10012000
# Watch a complex expression
(gdb) watch (rc != 0) && (counter > 100)
We can manage watchpoints like any other breakpoint: enable, disable, and delete using the same commands:
# Enable/disable a watchpoint using its number
(gdb) disable 2
(gdb) enable 2
# Delete a specific watchpoint
(gdb) delete 2
For example, in our project we can set a watchpoint to detect when the timer_isr_flag variable changes its value:
(gdb) watch timer_isr_flag
Read 4 bytes @ address 0x80000BB4 (Data = 0x00000000)
Read 4 bHardware watchpoint 5: timer_isr_flag
Hardware watchpoint 6: timer_isr_flag
(gdb) continue
Hardware watchpoint 8: timer_isr_flag
Old value = 0
New value = 1
0x20011418 in timer_isr (id=<optimized out>, data=<optimized out>)
    at src/sifive-welcome.c:57
57          timer_isr_flag = 1;
Viewing Variables, Memory and Disassembly
When there is a pause in the execution (after the next or step commands, any type of breakpoint, etc.) we can print the values of all local and global variables using the print command:
(gdb) [p]rint <expression>
It is possible to print complicated expressions, type casts, call functions, etc. Here are a few examples:
# Print a variable
(gdb) print wait_for_timer
# Print the value in hexadecimal format
(gdb) print /x *0x80000ad0
# Print the first three elements of an array
(gdb) print *array@3
GDB also provides a handy command called printf for formatted printing. It supports most of the standard C conversion specifications:
# Formatted printing
(gdb) printf "led0_green size = %d, address = %p\n", sizeof(led0_green), ((void*)*led0_green)
Read 4 bytes @ address 0x80000ACC (Data = 0x20011288)
led0_green size = 4, address = 0x20011288
Another option is the display command. It takes the same arguments as print, but prints the specified item every time the program stops:
(gdb) display led0_blue
1: led0_blue = (struct metal_led *) 0x80000ad0 <__metal_dt_led_2>
(gdb) next
Performing single step...
150             wait_for_timer(led0_red);
1: led0_blue = (struct metal_led *) 0x80000ad0 <__metal_dt_led_2>
It’s also possible to print the values of all the local variables in the current stack frame by invoking the info locals command:
(gdb) info locals
rc = 0
led0_red = 0x80000ac8 <__metal_dt_led_0>
led0_green = 0x80000acc <__metal_dt_led_1>
led0_blue = 0x80000ad0 <__metal_dt_led_2>
Examining Memory
GDB offers a convenient way of inspecting memory regions using the x command. The functionality is very similar to what we have in any IDE. The syntax is the following:
x/nfu <address>
Where nfu are optional parameters that are responsible for how much data to show and how to format it. It supports various styles, including binary, decimal, hex, or even strings. Here is the memory dump for the region where the main function is located:
(gdb) x/64i main
0x200115ba <main>:      0x39    0x71    0x06    0xde    0x22    0xdc    0x26    0xda
0x200115c2 <main+8>:    0x4a    0xd8    0x4e    0xd6    0xb7    0x05    0x01    0x20
0x200115ca <main+16>:   0x93    0x85    0xc5    0x71    0x37    0x09    0x01    0x20
0x200115d2 <main+24>:   0x13    0x05    0x09    0x72    0xef    0x20    0x10    0x14
0x200115da <main+32>:   0x2a    0x84    0xb7    0x05    0x01    0x20    0x93    0x85
0x200115e2 <main+40>:   0x45    0x72    0x13    0x05    0x09    0x72    0xef    0x20
0x200115ea <main+48>:   0xf0    0x12    0xaa    0x84    0xb7    0x05    0x01    0x20
Disassembly
GDB has built-in support for printing machine code for any function or a range of memory. We can quickly do that using the disassemble command:
[disas]semble <function | address1, address2>
This command disassembles any function into assembly instructions, shows the address, name, and operands of each instruction:
(gdb) disassemble wait_for_timer
Dump of assembler code for function wait_for_timer:
   0x2001155a <+0>:     addi    sp,sp,-16
   0x2001155c <+2>:     sw      ra,12(sp)
   0x2001155e <+4>:     sw      s0,8(sp)
   ...
It can also provide a mixed view of disassembly together with source code by specifying the /s modifier. The /r modifier can be used to print the raw instructions in hex. Here is an example that prints the disassembly for a range of addresses:
(gdb) disassemble/sr 0x200115c2, 0x200115cd
Dump of assembler code from 0x200115c2 to 0x200115cd:
src/sifive-welcome.c:
84      {
   0x200115c2 <main+8>:         4a d8   sw      s2,48(sp)
   0x200115c4 <main+10>:        4e d6   sw      s3,44(sp)

85          int rc;
86          struct metal_led *led0_red, *led0_green, *led0_blue;
87
88          // This demo will toggle LEDs colors so we define them here
89          led0_red = metal_led_get_rgb("LD0", "red");
   0x200115c6 <main+12>:        b7 05 01 20     lui     a1,0x20010
   0x200115ca <main+16>:        93 85 c5 71     addi    a1,a1,1820 # 0x2001071c
End of assembler dump.
Conclusion
In this post, we continued to explore the debugging capabilities of the PlatformIO ecosystem. Although the command-line interface might not be as user-friendly as a feature-rich IDE, it’s still a great instrument to quickly and efficiently hunt down bugs in your code base. The fact that CLI needs much fewer resources gives us the ability to debug applications even in a headless OS while keeping the same level of functionality.
In the next part we will explore a very useful technique called “semihosting” used for communicating I/O requests from application code to a host computer running a debugger.
Stay in touch with us
Stay tuned to this blog or follow us on LinkedIn and Twitter @PlatformIO_Org to keep up to date with the latest news, articles and tips!