Debugging with PlatformIO: Part 1. Back to the Basics
A brief introduction to the debug workflow used in PlatformIO Unified Debugger
Debugging is an inseparable part of the development process. People make mistakes, so our code doesn’t do what we expect once in a while. Often such problems happen at the worst possible time. That’s why it’s a good idea to master debugging techniques and skills to more precisely isolate the source code of a problem and fix it in a timely manner.
In the Debugging with PlatformIO series, we will be exploring the debugging capabilities of the PlatformIO ecosystem. This series will walk you through the core concepts of the debug workflow implemented in PlatformIO Unified Debugger. In each part, we will explore new features and techniques which can greatly help us out when we bump into a thorny problem in a real project.
This series will cover a broad range of topics, starting from the basics like debugging a simple application running on your machine up to advanced topics like debugging a suite of unit tests on a remote embedded target. In each following post, we will use a new combination of debug probes and targets to show how easy it’s to switch between hardware simply by changing several lines in the PlatformIO configuration file. For your reference, below is a list of the articles in this series:
- Part 1. Back to the Basics (this article)
- Part 2. Debugging an Embedded Target
- Part 3. PlatformIO Unified Debugger in CLI mode
- Part 4. Using Semihosting on ARM Targets (coming soon).
Although throughout this series we will be using the PlatformIO IDE for VScode, PlatformIO Unified Debugger supports many other Desktop and Cloud development environments, including Eclipse and JetBrains CLion.
The first part provides a brief introduction to the debugging concept and gives a basic overview of debugging process used in the PlatformIO IDE for VSCode without any reference to the embedded software development. Setting breakpoints, adding watch expressions, and other essential features of the debugger are covered in this part.
Table of Contents
- Prerequisites
- Basic Principles
- PlatformIO Unified Debugger
- Getting Started
- Working with Debugger
- Conclusion
- Stay in touch with us
Prerequisites
This article uses the following components:
Basic Principles
Modern software may be extremely complex, and sooner or later, we’ll find ourselves in a situation when some part of the code doesn’t work as expected. It’s not always clear what causes our code to behave incorrectly or even crash, so we need to get involved and figure out why and where an error occurs in our program. That process of finding and fixing such errors (so-called “bugs”) is called Debugging. Even though debugging is mostly a unique experience, a few general debugging principles can be picked out:
- Reproduce the problem reliably
- Locate the source of the problem
- Understand the root cause of the problem
- Find a solution for the problem
- Apply the solution and test the fix
While in simple projects we can make do with printing messages directly to the debug console as the code executes (commonly known as “Print Debugging”), it’s definitely a waste of time when it comes to reasonably complex projects. In such cases, we need more advanced and comprehensive instruments to better understand what actually is happening inside our code. Such tools are called debuggers. In general, debuggers allow working with the code interactively, controlling the execution line-by-line, examining CPU registers, inspecting variables, etc.
It’s also worth mentioning that to make use of a debugger we need to compile our code with debugging information (e.g. function locations). In general, such information is inserted by a compiler through the use of debugging symbols. An executable with debugging symbols can be executed as a regular binary, but it may be a slightly bigger size and run a bit slower due to disabled optimizations.
PlatformIO Unified Debugger
Bringing up a debug configuration might be a daunting task. Developers need to get through complex UI windows just to configure a debugger before a debug session can be launched.
PlatformIO Unified Debugger is a user-friendly and extensible unified debugging environment with a set of advanced instruments, providing modern and powerful features to speed up, yet simplify, the creation and delivery of modern applications. A zero debugging configuration with support for the most popular debugging probes and compatibility between IDEs/OSes allowed to simplify the debugging process.
Developers can finally forget about complex UI windows which they need to pre-configure before a simple “Hello World!” debug session. No need to know any aspects about the debugging server or how to configure it because PlatformIO Unified Debugger does all the heavy lifting behind the scenes.
Getting Started
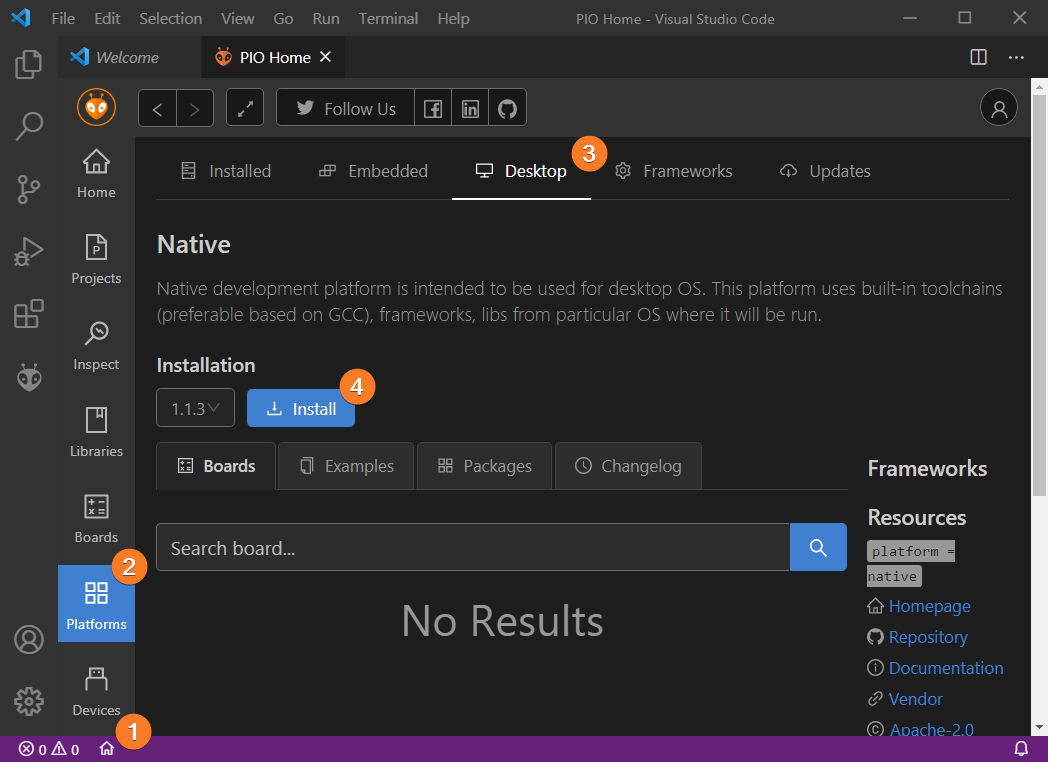
First, we need to install the native development platform. PlatformIO doesn’t install any toolchains automatically for the native dev-platform and uses the toolchain (preferably based on GCC) native for your OS (on Windows it’s recommended to install MinGW and make it available via the PATH variable). Let’s install the native dev-platform via PlatformIO Home:
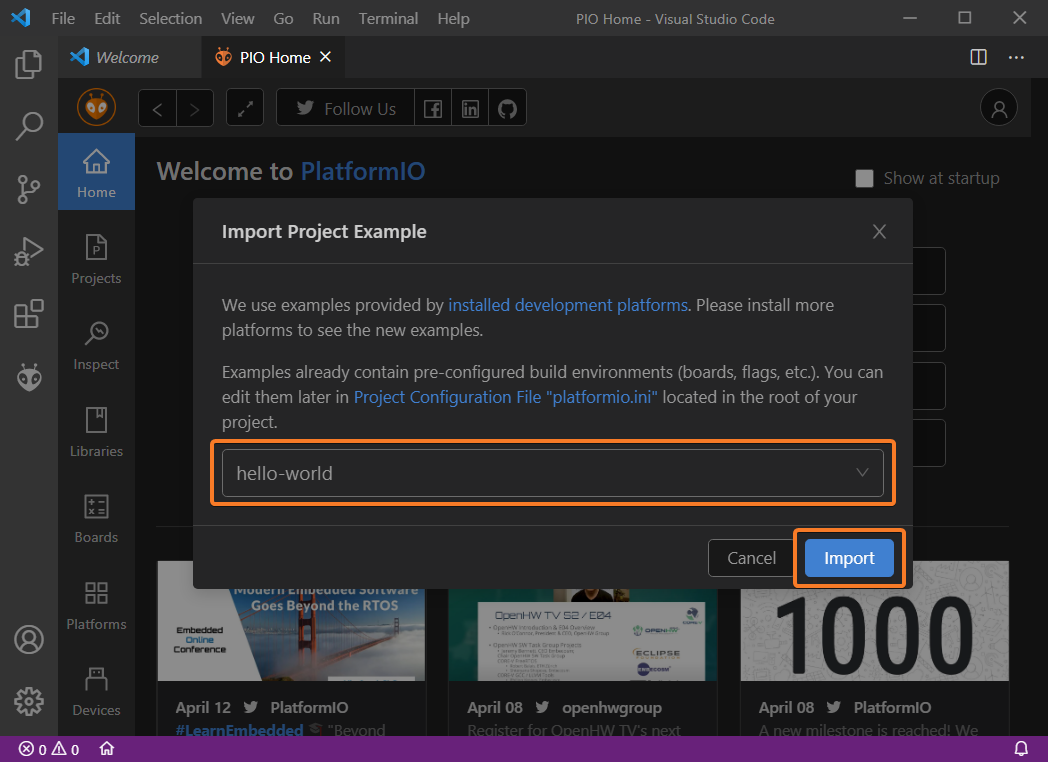
For the sake of simplicity, let’s write a simple application that sorts an array of integers using the Quicksort algorithm. Instead of creating our project from scratch, we can import a “Hello World” example using the PlatformIO Home page:
Then simply replace the default code in main.c with the following code:
#include <stdio.h>

void swap(int* xp, int* yp)
{
    int temp = *xp;
    *xp = *yp;
    *yp = temp;
}

void sort(int* array, int first, int last)
{
    if (first < last)
    {
        int left = first, right = last, middle = array[(left + right) / 2];
        do
        {
            while (array[left] < middle) left++;
            while (array[right] > middle) right--;
            if (left <= right)
            {
                swap(&array[left], &array[right]);
                left++;
                right--;
            }
        } while (left <= right);
        sort(array, first, right);
        sort(array, left, last);
    }
}

int main()
{
    puts("Getting started with PlatformIO Unified Debugger!\r\n");
    int input_array[] = { 8, 34, 13, 17, 34, 90, 48, 72, 50, 86 };
    int length = sizeof(input_array)/sizeof(input_array[0]);
    sort(input_array, 0, length-1);
}
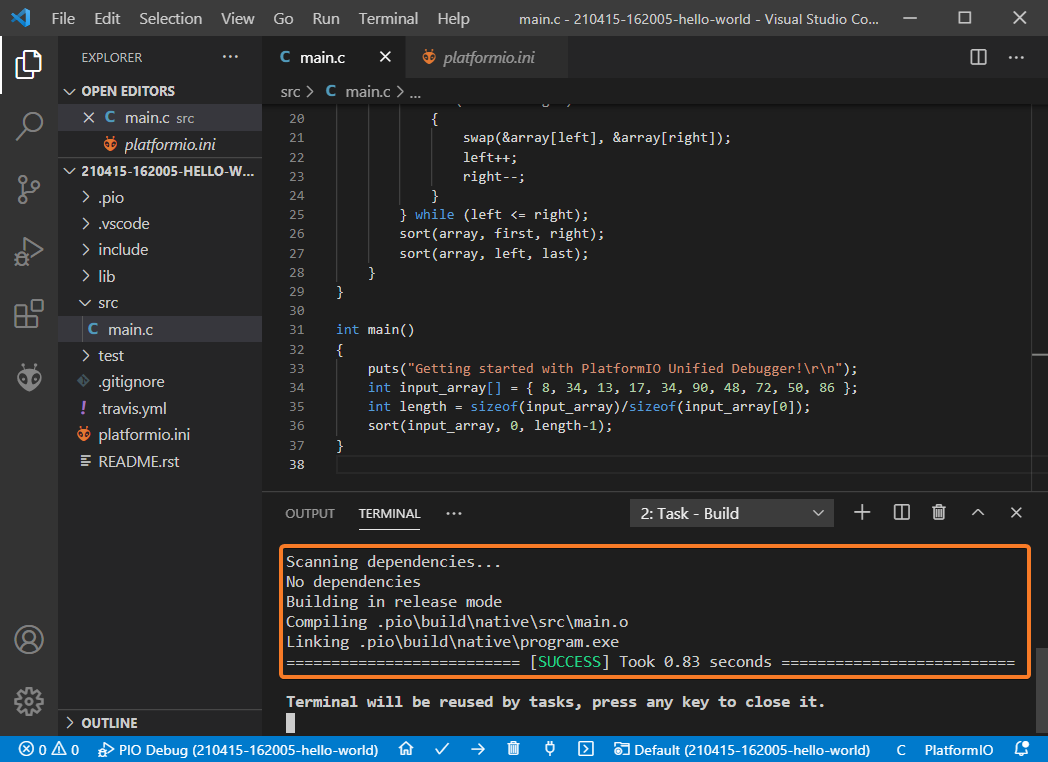
If we try to build the imported project, we should see the successful result:
Please note that the goal of this post is to focus on the debug workflow, so don’t rely on the code presented above in real projects.
Working with Debugger
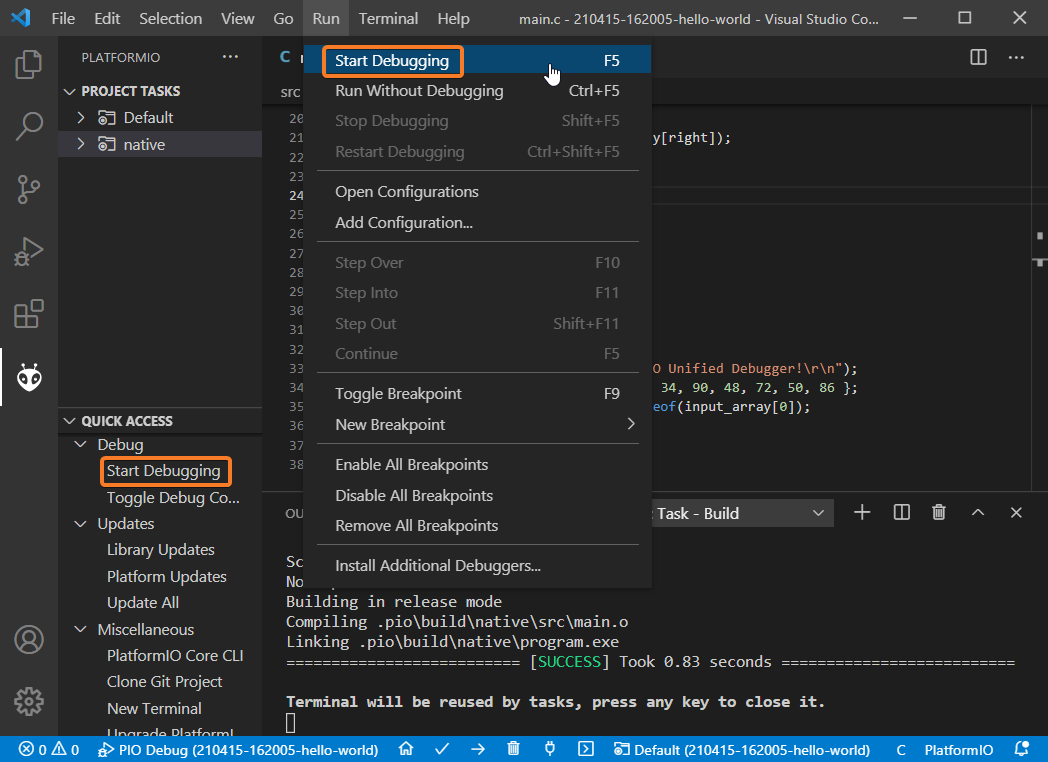
Now we are ready to start debugging! To launch a new debug session we can use the following options:
- Debug: Start debugging from the top menu
- Start Debugging option from the
Quick Accessmenu - Hotkey button
F5:
Our program will start executing and then stop at the first breakpoint. Keep in mind that, by default, PlatformIO instructs the debugger to stop at the main function. Let’s take a closer look at our project using the debugger and its features.
Debug View
When we start a debug session, the IDE switches to the “Debug View” with several panes which provide easy access to the debugger’s functionality:
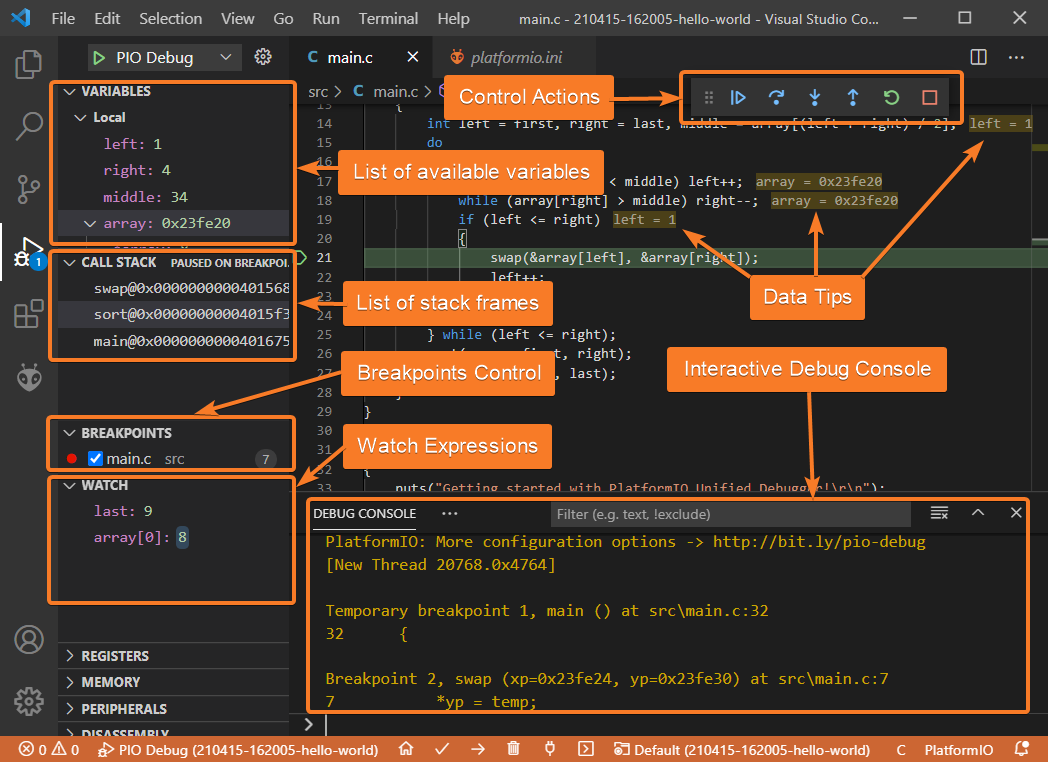
Let’s look around and examine the most important elements.
Controlling the program execution
The Debugger View provides complete control of the debugging process. You can access most of the essential control actions such as:
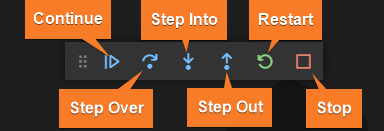
Continue/Pause (F5)runs the program until it locates a breakpoint and then stops.Step Over (F10)executes the current statement and all functions that the statement calls and doesn’t suspend the execution until functions return.Step Into (F11)advances the execution to the next statement. If the current statement is a function call, then the debugger steps into that function.Step Out (Shift+F11)moves the execution out of the current function and back to the statement where the function was called.Restart (Ctrl+Shift+F5)is a convenient shortcut for two operations: stopping the debug session and restarting the debugger.Stop (Shift+F5)stops the debug session and terminates the program.
Managing Breakpoints
Breakpoints are one of the most important features of the debugging process. A breakpoint is a mechanism to suspend the execution of an application to inspect the state of variables with the ability to modify them to figure out why a problem is occurring. Usually, breakpoints are shown as red-filled circles in the editor margin.
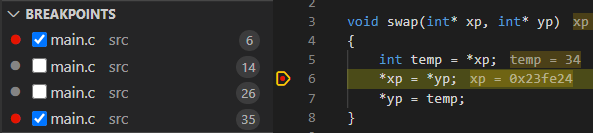
We can toggle breakpoints directly in the editor pane by clicking on the left margin next to the current line or using the F9 hotkey. A more precise configuration like group enabling, disabling, or setting breakpoint conditions can be done in the Breakpoints section. In the next posts in this series, we will take a deeper look at more advanced breakpoint configuration, including conditional and data breakpoints.
Call Stack
Each time when the debugger pauses the execution (due to a breakpoint or during stepping), the sequence of function calls is displayed in the “Call Stack” window:
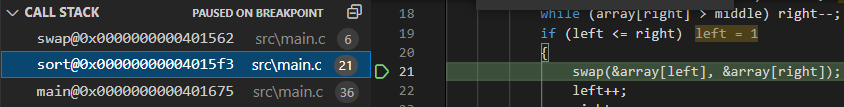
The “Call Stack” window is useful when we need to examine the actual execution flow of an application. It shows the name of each called function, its address in memory, the file name and the line number where the function is defined. We can jump between stack frames and the debugger will automatically update the variables and registers. A green line will show where the execution pointer is currently located according to the selected stack frame.
Working with Variables
The examination of variables is one of the essential steps for understanding why an application operates incorrectly. When the debugger is suspended, the “Variables” window allows us to inspect and modify the variables available in the context where an application is paused:
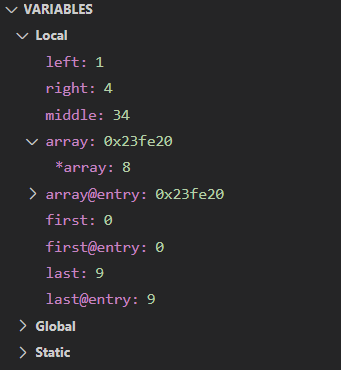
If we double-click the value for a variable, we can edit its value. It may be useful when there is a need to verify how an application would work in a certain condition at runtime.
Watch Expressions
The Watch window allows us to specify a variable (or an expression) that will be reevaluated and displayed every time the debugger stops:
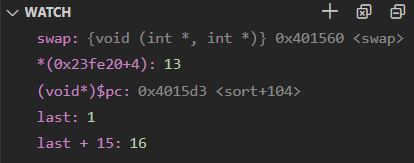
To add a new watch expression click the + button in the top right corner of the panel, type the expression into the text field, and press Enter to save it. The expression will be evaluated each time when the code hits a breakpoint or when we step through the code. Unlike the frame-specific “Variables” window, the “Watch” window always shows the variables that we’ve added.
Conclusion
All developers make mistakes, and as a result, bugs show up. Learning how to debug effectively takes time, but in the long run, it can make the development process less stressful when an unexpected side effect happens. A debugger in any programming language is an essential instrument for tracking down problems in code, especially in a large and complex codebase.
In this post, we only scratched the surface of capabilities available in PlatformIO Unified Debugger. There is a lot of useful functionality we didn’t cover in this post which can greatly help us in real projects. The next post will be more embedded-specific, we’ll look at some more advanced features, such as peripheral and disassembly views, advanced breakpoints, and much more!
Stay in touch with us
Stay tuned to this blog or follow us on LinkedIn and Twitter @PlatformIO_Org to keep up to date with the latest news, articles and tips!