Debugging with PlatformIO: Part 2. Debugging an Embedded Target
An introduction to debugging of embedded systems using PlatformIO Unified Debugger
Embedded systems are becoming more complex, more autonomous, and more intelligent. The rise of the ML and AI technologies fuels the complexity of embedded software even further. It’s getting increasingly difficult to hunt down and isolate errors in the code, but at the same time, the demand for reliability continues to grow as well. With this increased complexity comes a need for more advanced and efficient debug instruments that will help to prevent bugs in production and find issues much easier.
This is the second part of a four-part blog series where we’re exploring the debugging workflow implemented in PlatformIO Unified Debugger. In the first post, we briefly went through the fundamental concepts of the debugging process, learned how to control the execution flow of an application, and reviewed the essential components of the “Debug” perspective.
In this article, we will focus on how to apply that knowledge to debugging an embedded target. This part also aims at providing a brief overview of how debugging of an embedded system works behind the scenes and what advanced instruments may be helpful for efficient debugging.
Throughout this post, we will be using the ST Nucleo-F401RE board and STM32Cube as the development framework.
Table of Contents
- Prerequisites
- Introduction to Debugging Embedded Targets
- Advanced Instruments
- Conclusion
- Stay in touch with us
Prerequisites
This article uses the following components:
Introduction to Debugging Embedded Targets
Most of the time, debugging an embedded system is not very different from debugging a desktop application. Usually, the host machine, where our development environment is running, doesn’t have any facilities to access the state of external hardware. That’s why we need to configure an additional set of hardware and software components so we can translate the commands sent from the debugger on a host machine to a target device using some sort of communication channel. Before we dive into the details of the debugging workflow, let’s take a quick look at a typical setup for debugging an embedded target.
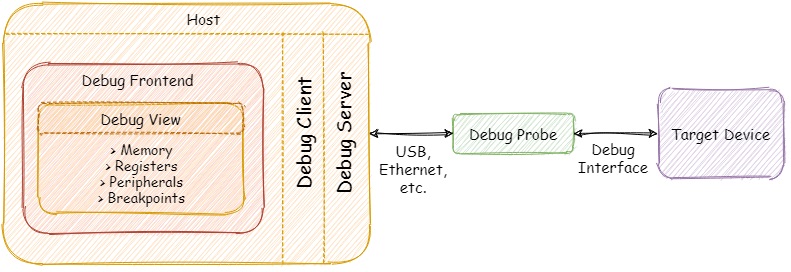
Let’s go through the main components of the configuration depicted above.
Debug Interfaces
Nowadays there are two prevalent interfaces used for debugging embedded systems: JTAG and Serial Wire Debug (SWD). The classic JTAG was developed in the ’80s by the Joint Test Access Group as a standard for verifying designs and testing printed circuit boards after manufacture. Today, JTAG is widely adopted by the semiconductor industry and frequently used for programming, testing and debugging embedded systems. The main disadvantage of the JTAG interface is that it requires at least four pins (TRST is optional) for normal functioning. This might be a problem when we are using small package ICs with a limited number of pins.
There is a simplified alternative interface called Serial Wire Debug (SWD) developed by Arm. It replaces the JTAG interface with two signals - a single bi-directional data line (SWDIO) and clock (SWCLK), providing all the usual debug and test functionality with higher performance compared JTAG. Although a lot of modern microcontrollers support both JTAG and SWD interfaces, SWD is a proprietary interface and can be used mostly within the Arm ecosystem.
Debug Probes
We can describe debug probes as hardware mediators between the host machine and the debug port of the target embedded system. The main task of any debug probe is to convert commands from the debugger into signals understandable to the target device. Usually, debug probes are connected to the host via USB, but there are also more exotic variations with Ethernet or Wi-Fi connectivity allowing developers to debug devices even remotely from anywhere in the world.
There is a plenty of debug adapters available in the market, starting from open-source and vendor-agnostic probes (Black Magic Probe) up to proprietary solutions from both silicon vendors (Atmel-ICE, ST-Link) and independent commercial companies (Segger J-Link). Some vendors also offer development kits (Nordic nRF52-DK, NXP i.MX RT1010) with an onboard debug probe so developers can start debugging without any additional hardware.
It’s worth mentioning that PlatformIO Unified Debugger is highly configurable and can be used with a wide variety of debug probes, it also provides a huge set of predefined configurations for development kits that have built-in debug circuitry. It means that developers don’t need any debug configuration, just connect your board and start a new debug session.
Debug Servers
Simply put, a debug server is a piece of software running on the host machine that acts as a bridge between the debugger and the debug probe connected to the target device. OpenOCD is one of the best examples of free and open-source debug servers. It’s a community-driven project with a huge number of supported debug probes and target devices. Another example is pyOCD - an open-source package for programming and debugging Arm Cortex-M microcontrollers. On the other hand, there are companies like Segger that offer their own set of tools (including debug servers) that better utilizes the capabilities of their J-Link debug probes. There are also debug probes that don’t need any intermediary host software at all (e.g. Black Magic Probe) and can interact with debuggers directly by mimicking a debug server over a serial port.
Advanced Instruments
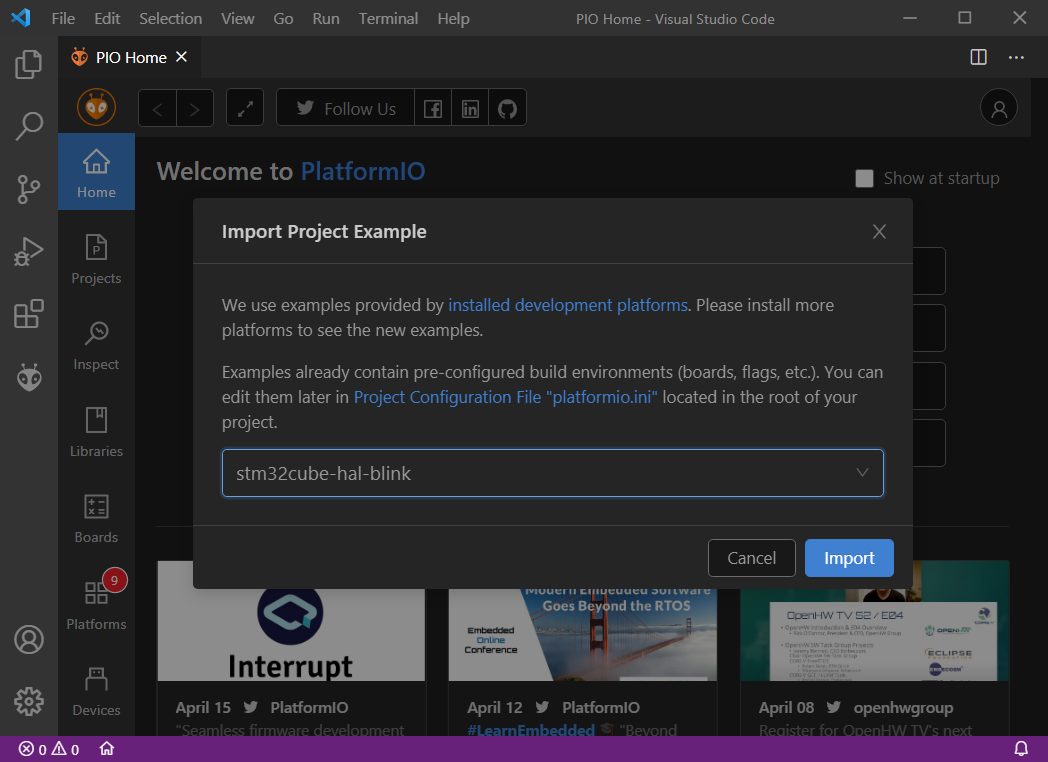
In addition to the basic components of the Debug View reviewed in the previous part, let’s take a look at the instruments that might be useful when debugging an embedded target. For the sake of simplicity, let’s get started by importing the stm32cube-hal-blink example directly from the PlatformIO Home page:
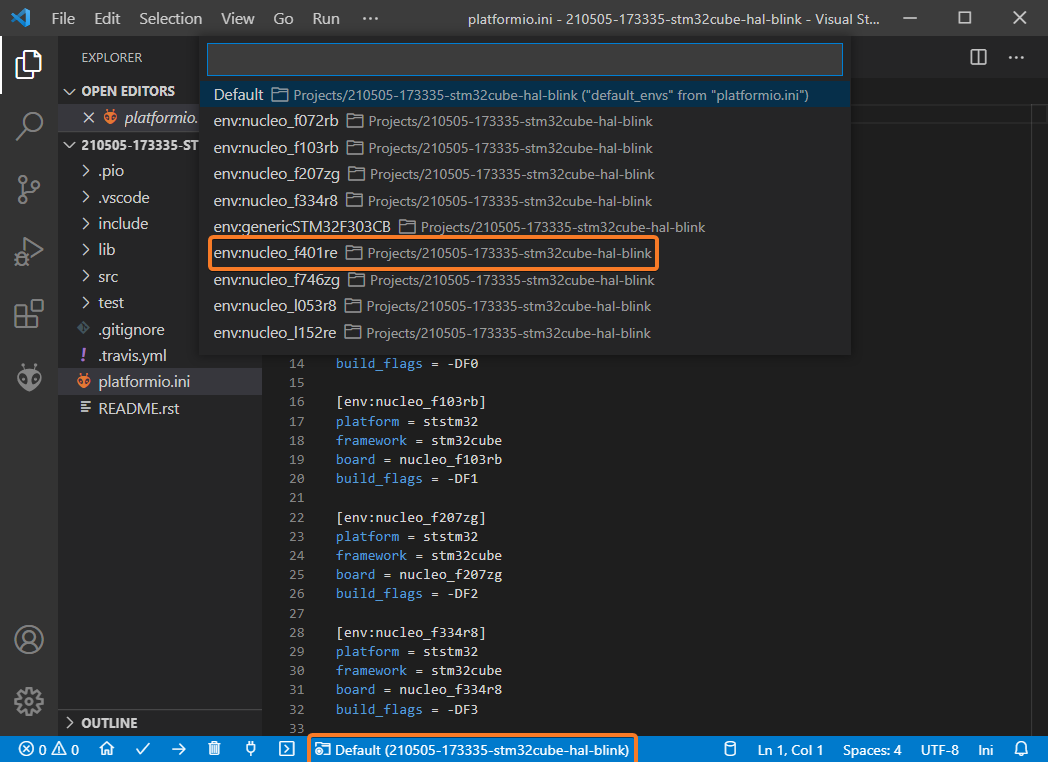
This example contains a lot of environments, but we need to select nucleo_f401re according to the board used in this post:
Now we are ready to start debugging! To launch a new debug session we can use the following options:
- Debug: Start debugging from the top menu
- Start Debugging option from the
Quick Accessmenu - Hotkey button
F5:
Once a new debug session is started we can open the advanced panes of the Debug View:
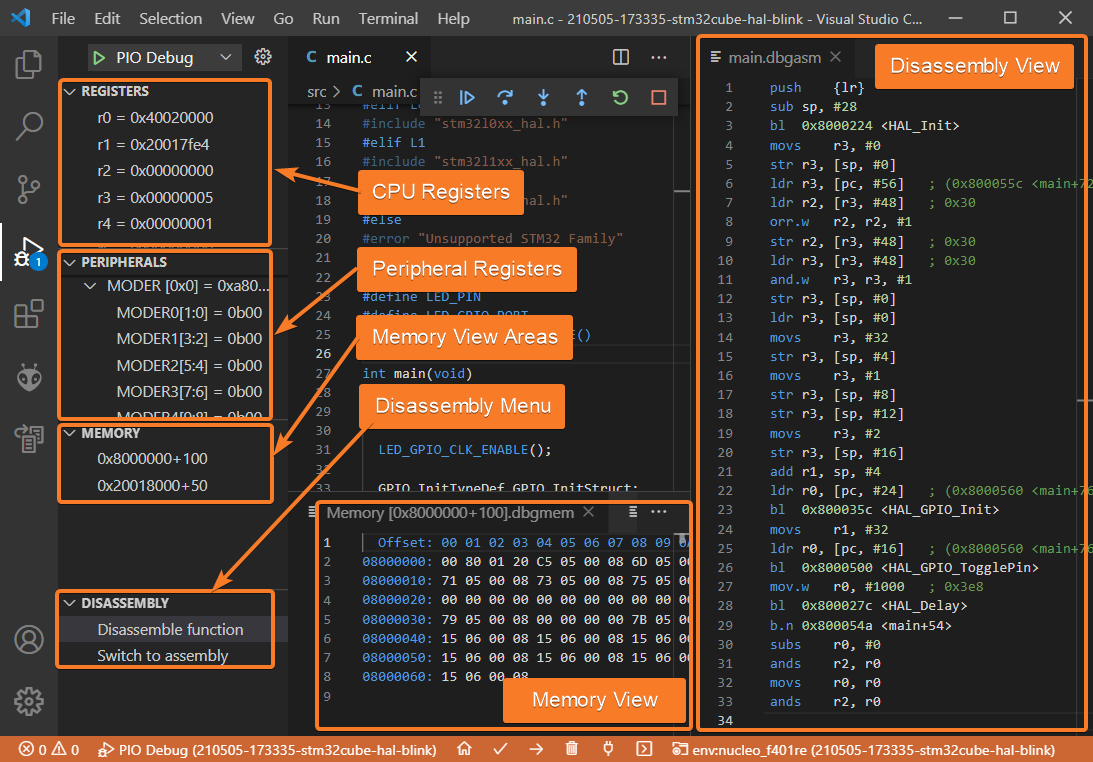
Let’s examine them in greater detail.
Registers and Peripherals
These windows show the current state of the processor and peripheral registers:
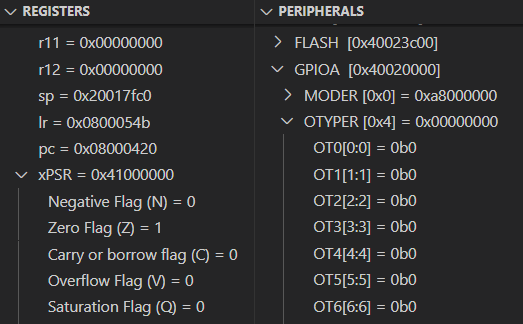
The Registers and Peripherals windows are especially useful for finding out the root cause of fault-related exceptions that occurred during the normal execution flow. Additionally, if we combine these windows with the Disassembly view discussed below we can get a powerful environment for very low-level debugging in cases when there is no actual source code available to step through. Note that the Registers and Peripherals windows are platform-specific, so a different target might have a different set of registers.
Memory Window
In contrast to the “Variables” and “Watch” panes, the “Memory” window shows the raw contents of memory at a specific address:
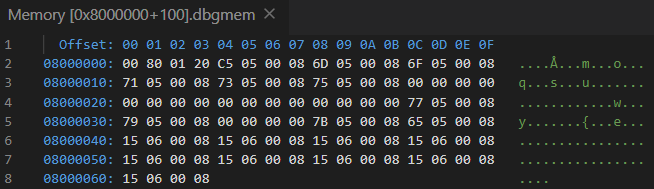
This window is useful for examining large chunks of memory that can’t be displayed in a meaningful manner in other panes. It displays everything in the selected memory area, including code, constants and even random garbage in uninitialized memory. You can open several instances of the “Memory” windows if you want to monitor several different memory areas simultaneously.
Disassembly Window
This window shows assembler instructions mixed with source code for the application being debugged:
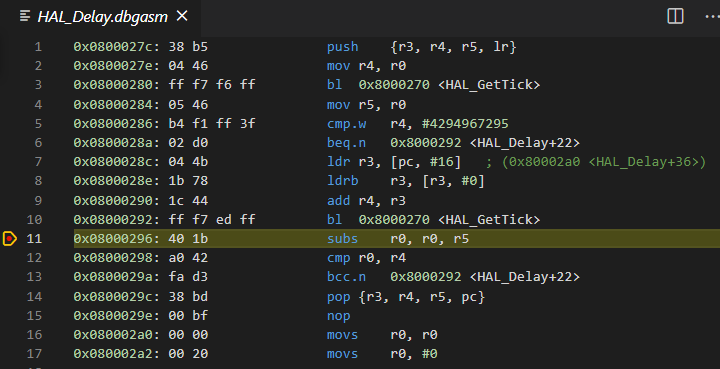
The “Disassembly” allows you to carry out all the normal debug actions including single-stepping and setting breakpoints on the level of individual assembly instructions generated by the compiler. Note that this window automatically appears if there is no source code available.
Conclusion
Debugging is an unavoidable part of the development process and embedded software is no exception. Debugging can consume a considerable amount of time and that’s why developers should take advantage of modern instruments to accelerate the debugging process and make it significantly easier to more precisely track down and diagnose errors in their codebase.
In this post, we continued to explore the debugging capabilities of the PlatformIO ecosystem. Powerful features like the Peripherals, Memory, and Disassembly views are extremely useful when we need to take a deeper look at the low-level state of the target. In the next part, we’ll review advanced best practices, tips and tricks for efficient debugging, including PlatformIO Unified Debugger in CLI mode.
Stay in touch with us
Stay tuned to this blog or follow us on LinkedIn and Twitter @PlatformIO_Org to keep up to date with the latest news, articles and tips!