Analyze your firmware footprint with PlatformIO: Part 1. Intro and basic analysis
Introduction to the basics of memory analysis
Nowadays, microcontrollers are becoming more powerful and efficient, but at the same time, embedded applications are getting even more sophisticated. That complexity requires additional RAM and Flash memory to support all expected features. Besides, if a device needs additional memory to perform over-the-air updates then the memory requirements become even more crucial.
This blog post is the first part of a two-part series on how to analyze the memory footprint in the PlatformIO ecosystem. We will start by analyzing the default memory report after the successful compilation, in the next post we’ll try more advanced PlatformIO instruments which help analyze application memory usage more precisely and comprehensively.
For your reference, below is a list of the articles in this series:
Table of Contents
Executables
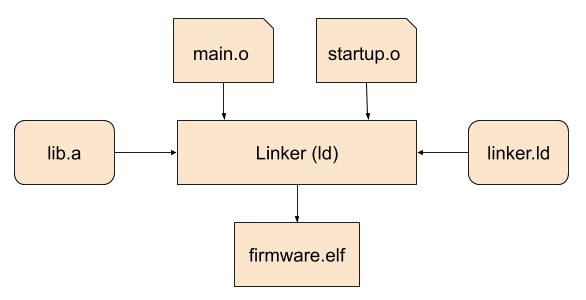
Typically the process of creating an executable consists of several steps and uses a few tools from an appropriate toolchain package. After source files are compiled, the corresponding relocatable object files and additional libraries are linked together into an executable file by a special tool called “linker”. The linker knows where to place the data from object files and libraries by reading linker scripts that describe the actual memory structure specific to the hardware and a use case.
Describing the compilation process is outside the scope of this article. If you are interested in the understanding of compilation and linking processes, here is a great introduction.
Memory layout
There are several formats of binary files, one of the most used is Executable and Linkable Format (ELF) which is quite widespread among different platforms. To move further to the next steps, we need to get acquainted with the most important memory sections. Typically, an application contains the following commonly known sections:
.bss- contains data that can be modified by the application at runtime (statically initialized global and local variables without the default value). Usually, the system initializes this data with zeros before the program begins to run..data- contains data that can be modified by the application at runtime (statically initialized global and local variables with the default value).rodata- a read-only section for constant data (e.g. numeric constants, strings, etc).text- a read-only section that contains the executable instructions.
An approximate memory layout for a hypothetical target might be organized in the following way:
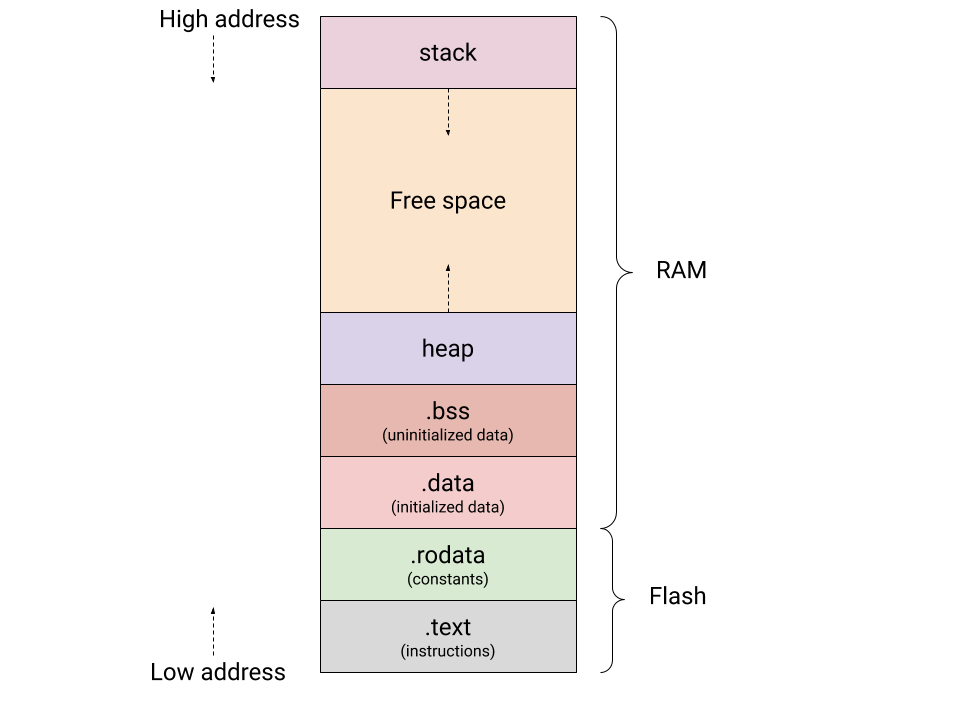
As shown on the figure above, the free memory area between the end of the .bss section and the lowest address in the stack can be be used for dynamic memory allocations.
Real-world Example
Let’s try to run a simple Blink example based on the STM32Cube framework on any supported board, in this article ST Nucleo-F401RE is used.
First, we need to install the ST STM32 platform by following instructions on this page. Once the ststm32 dev-platform is installed, we can import a basic STM32Cube example and compile it:
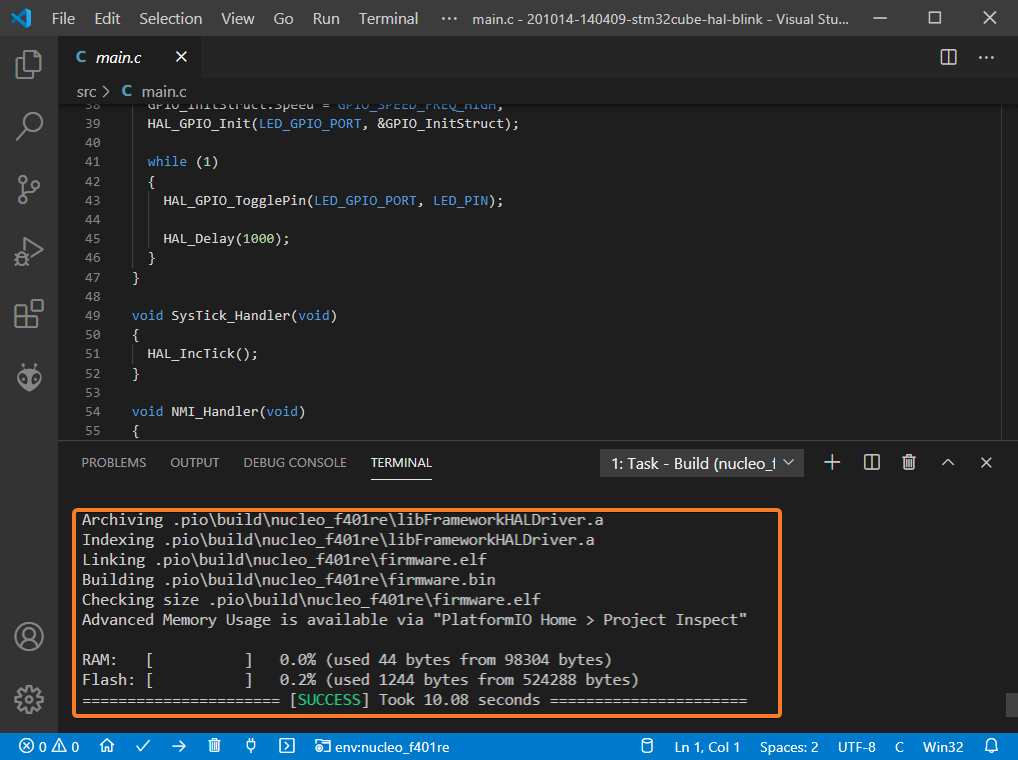
As shown on the image above, after the successful compilation PlatformIO reported basic information about Flash and RAM usage. In our case, it’s 44 bytes of RAM and 1244 bytes of Flash memory. This approximate information should be enough for most cases when developers just need to verify that new changes to the code base don’t introduce unnecessary memory overhead. But if such overhead has occurred, it might be useful to compile the project in verbose mode and see what exact sections are using up the largest part of the memory:
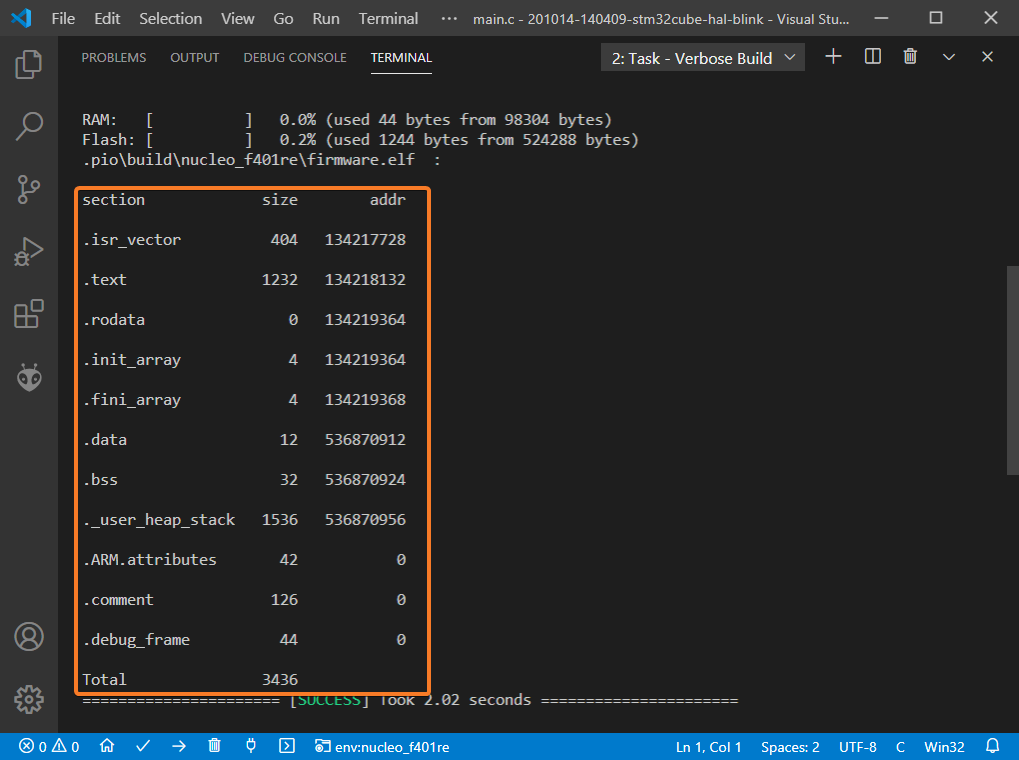
In this case, we see the memory footprint per section and their addresses in the decimal format. The most interesting of them were already described in the previous chapter, so let’s focus on a few new items (keep in mind that the full format of the ELF contains many more items):
._user_heap_stack- an auxiliary section specified in the linker script that checks whether there is enough RAM left.ARM.attributes- a section for hardware-specific attributes.comment- a section that holds version control information.debug_frame- additional debug information (part of the DWARF standard).isr_section- interrupt vector table at the start of the Flash memory.init_arrayand.fini_array- sections that hold arrays of pointers to functions that will be called on application initialization and termination accordingly
Summary
As it turned out, memory analysis is not that hard and even the default build information contains enough data to help estimate the memory footprint. In the next article, we’ll run through advanced PlatformIO instruments that show different ways of optimizing embedded applications by generating more comprehensive reports on memory usage.
Stay in touch with us
Stay tuned to this blog or follow us on LinkedIn and Twitter @PlatformIO_Org to keep up to date with the latest news, articles and tips!