Analyze your firmware footprint with PlatformIO: Part 2. Project Inspector
Introduction to advanced PlatformIO instruments
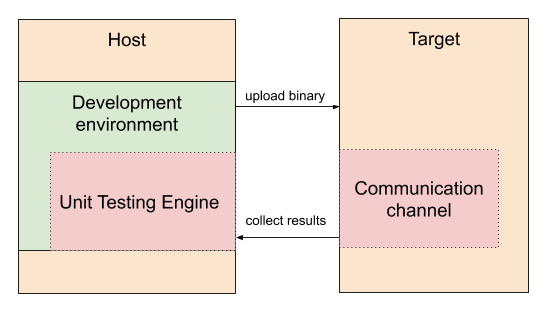
Have you ever wondered how the linker is assigning physical memory, where your code is placed in Flash, or how much RAM is used by an OS or peripheral drivers?
In the previous post, we briefly looked into general aspects of the memory layout of executable files. In this post, we will go deeper into the ELF file structure and memory analysis using a very useful PlatformIO tool called Project Inspector which allows analyzing application memory usage and provides specific information about which memory section a variable or function is placed in or what file this symbol is located in.
Table of Contents
Running Analysis
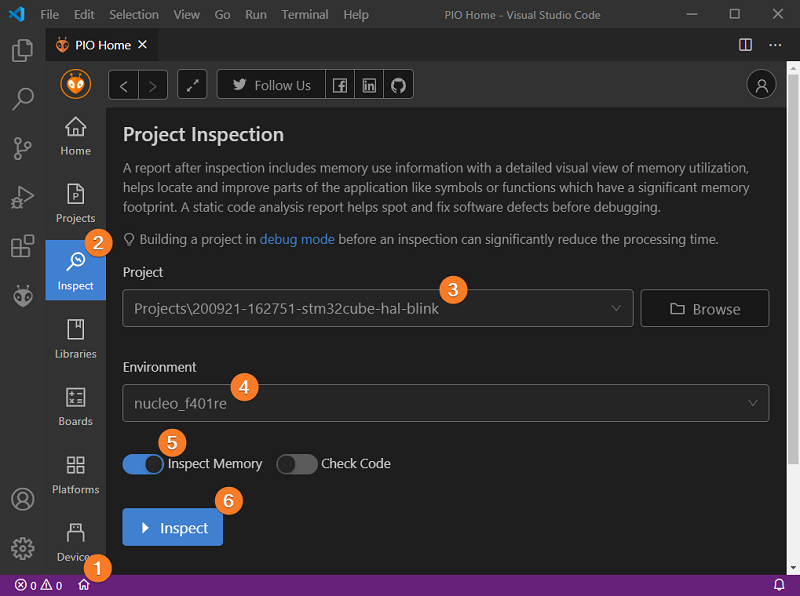
We already installed the ststm32 platform and imported a basic example in the previous blog post. Let’s analyze the same project, but this time via Project Inspector. On the PlatformIO Home page, navigate to the Inspect tab, select your project and environment, press the Inspect button:
Inspecting Results
Project Statistics
Once the analysis is done, PlatformIO will show a detailed report on memory usage. The first Statistics tab displays general information about used hardware, a graphical representation of the percentage of used memory, Top-5 files with the most significant contribution to the memory footprint, along with Top-5 largest symbols defined in the firmware:
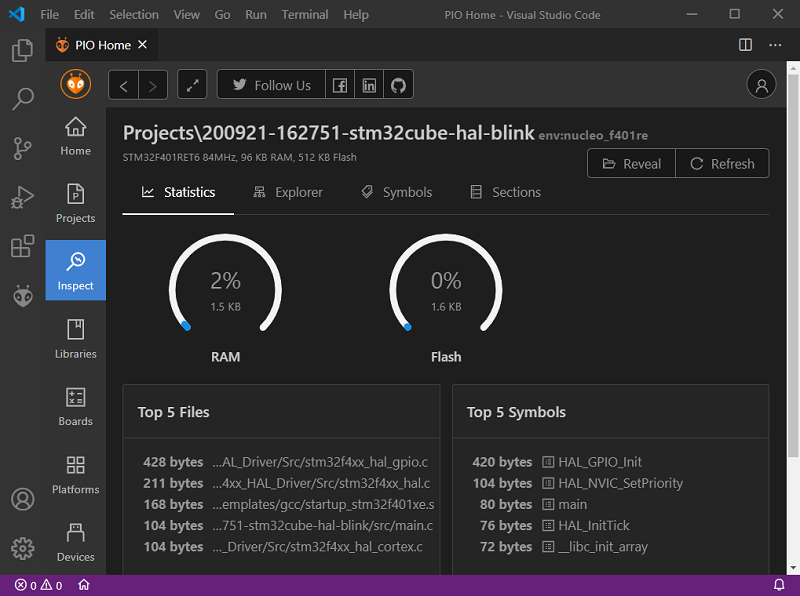
For example, in our case, the stm32f4xx_hal_gpio.c file has the highest memory consumption of 428 bytes.
As we can see, the report from Project Inspector a bit differs from the regular information reported after each build step. In this case, the differences can be explained by a different calculation method of memory consumption. Project Inspector also takes into account the memory section which was allocated for the stack and heap. Usually, it’s done in the project linker script and used to ensure that there is enough free memory left for the stack and heap to fit into the RAM. In code such verification may look like this:
_Min_Heap_Size = 0x200;      /* required amount of heap  */
_Min_Stack_Size = 0x400;     /* required amount of stack */
...
._user_heap_stack :
{
    . = ALIGN(4);
    PROVIDE ( end = . );
    PROVIDE ( _end = . );
    . = . + _Min_Heap_Size;
    . = . + _Min_Stack_Size;
    . = ALIGN(4);
} >RAM
...
The ._user_heap_stack (or similar name) is exactly the section that declares the memory area that could be allocated at runtime.
Project Explorer
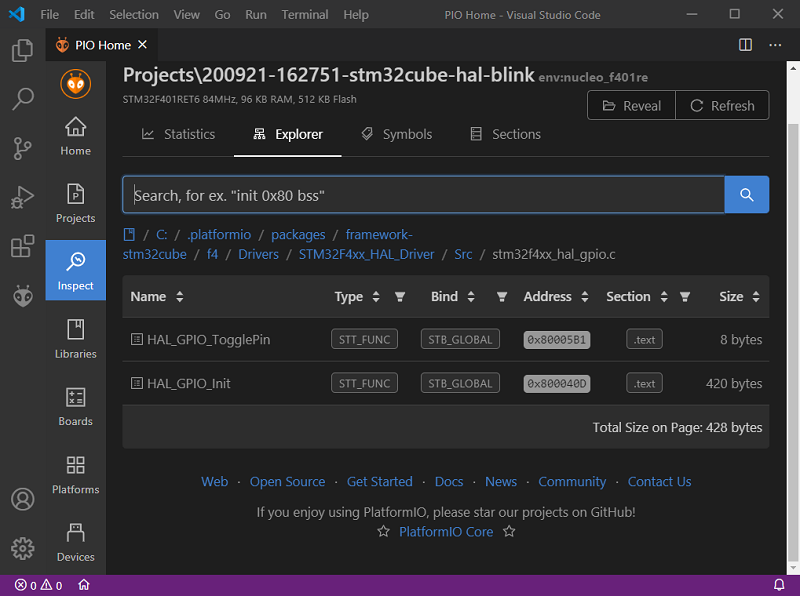
The Explorer tab provides a convenient way for navigating through project source files while displaying used RAM and Flash memory for each file. By clicking on any particular file we can see a detailed report on symbols defined in this file and their size:
Symbol Table
The Symbols page lists the most memory-consuming symbols in the entire project. Besides the information about size, address, and the memory segment where that symbols are located, there are also two additional columns that provide extra information:
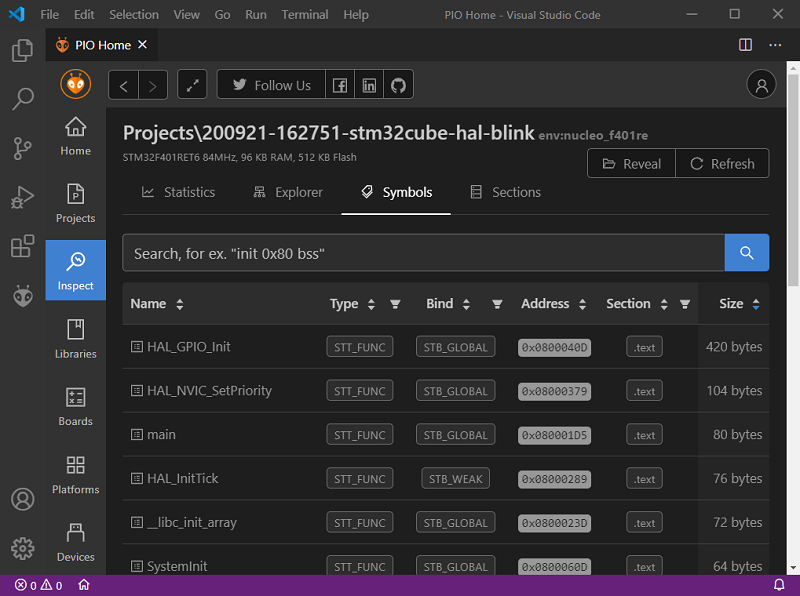
The Type column describes the specific type of each symbol. The most interesting for us are the following:
STT_OBJECT- This symbol is associated with a data object, such as a variable, an array, and so on.STT_FUNC- This symbol indicates that this symbol represents a function or other executable code.
The Bind column shows symbol binding type. For most applications, symbol types fall into the following three categories:
STB_LOCAL- Local symbols that are not visible outside the object file containing their definition. Local symbols with the same name may exist in multiple files without interfering with each other.STB_GLOBAL- Global symbols. These symbols are visible to all object files being combined.STB_WEAK- Weak symbols resemble global symbols, but their definitions have lower precedence.
We can also click on the magnifier icon on the right to the symbol name to open the corresponding source file and highlight the line where that symbol was defined.
Memory Sections
The last tab Sections is similar to the memory report after the verbose build, but shows extra information like section types and attributes:
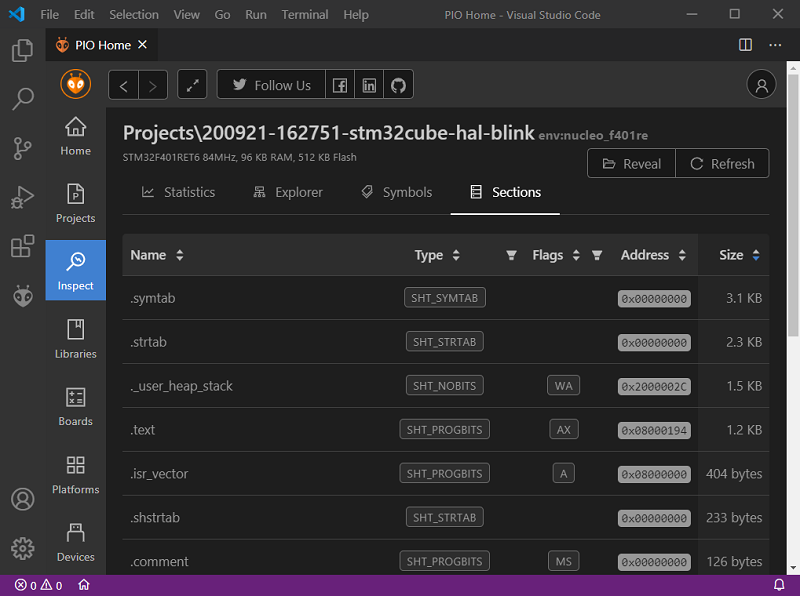
The Type column categorizes the section contents and semantics. A short description of the possible values:
SHT_PROGBITS- The section holds information defined by the program, includes executable code and dataSHT_NOBITS- A section of this type occupies no space in the file but otherwise resemblesSHT_PROGBITS(for example.bsssection)SHT_STRTAB- The section holds the string tableSHT_SYMTAB- The section holds the symbol table
The Flags column describes miscellaneous section attributes The most interesting for us are the following:
W (SHF_WRITE)- The section contains data that should be writable during process execution.A (SHF_ALLOC)- The section occupies memory during process execution (used to attribute control sections that don’t reside in the memory image of an object file).X (SHF_EXECINSTR)- The section contains executable machine instructions.
If you are interested in more detailed information about the structure of ELF files, here is a great man page.
Summary
Advanced analysis tools are becoming more useful as the modern firmware in embedded systems is getting highly complicated. Such tools enable developers to better understand how optimization flags, standard libraries, or even coding style affect memory consumption. Dismissive attitude towards optimization may lead to nonrecoverable software failures after deployment, especially on embedded systems where code space is a very constrained resource.
If you liked this series, you are sure to enjoy our series on other topics:
Stay in touch with us
Stay tuned to this blog or follow us on LinkedIn and Twitter @PlatformIO_Org to keep up to date with the latest news, articles and tips!